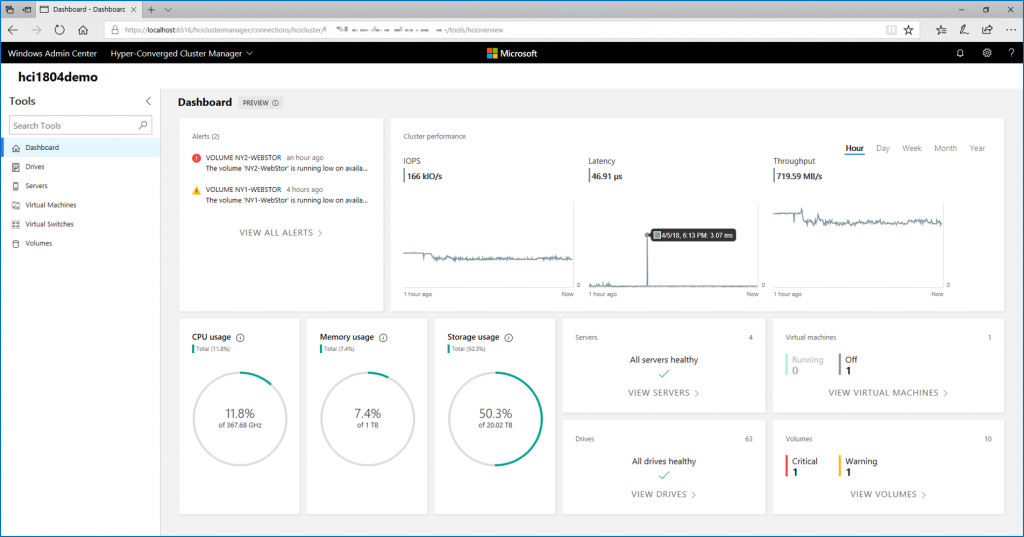
When you deploy VMware vSAN in the vSphere environment, the solution comes from several tools to monitor, find performance bottleneck and to troubleshoot VMware vSAN issue. All the information that I’ll introduce you in this topic are built-in to vCenter. Unfortunately, all vSAN configuration, metrics and alerts are not available yet from HTML5 board. So the screenshots were taken from VMware vCenter flash board.
Check the overall health of VMware vSAN
Many information are available from the vSAN cluster pane. VMware has added a dedicated tab for vSAN and some performance counters. In the below screenshot, I show the overall vSAN Health. VMware has included several tests to validate the cluster health such as the hardware compatibility, the network, the physical disk, the cluster and so on.
The hardware compatibility list is downloaded from VMware to validate if vSAN is supported on your hardware. If you take a look at the below screenshot, you can see that my lab is not really supported because my HBA are not referenced by VMware. Regarding the network, several tests are also validated such as the good IP configuration, the MTU, if ping is working and so on. Thanks to this single pane, we are able to check if the cluster is healthy or not.

In the capacity section, you get information about the storage consumption and how the deduplication ratio.

In the same pane you get also a charts which give you the storage usage by object types (before deduplication and compression).

The next pane is useful when a node was down because of an outage or for updates. When you restart a node in vSAN cluster, this last must resync information from its buddy. When the node was down, lot of data were change on the storage and the node must resync these data. This pane indicates which vSAN objects must be resynced to support the chosen RAID level and the FTT (Failure To Tolerate). In case of resync, this pane indicates of many components to resync, the remaining bytes to resync and an estimated time for this process. You can also manage the resync throttling.

In Virtual Objects pane, you can get for each vSAN object the health state. You can check also if the object is compliant with the VM storage policy that you have defined (FTT, RAID Level, Cache pining etc.). Moreovoer, in the physical disk placement tab, you get also the component placement and which are active or not. In my lab, I have a two-node vSAN cluster and I have defined in my storage policy RAID 1 with FTT=1. So for each object, I have three components: two times the data and witness.

In physical disks pane, you can list the physical disks involved in vSAN for each node. You can know also which components are store on which physical disks.

In the proactive tests, you can test a VM creation to validate that everything is working. For example, this test helped me one time to troubleshoot MTU issue between hosts and switches.

vSAN performance counters
Sometime you get poor performance and you expect better. So, you need to find the performance bottleneck. The performance counters can help you to troubleshoot the issue. In performance tab you get the classical performance counters about CPU memory and so on.

VMware has also added two sections dedicated for vSAN performance counters: vSAN – Virtual Machine Consumption and vSAN – Backend. The below screenshot shows you the first section. It is useful because this section indicates you the throughput, the latency and the congestion.

The other section presents performance counters related to backend. You can get the throughput taken by resync job, the IOPS ad latency of vSAN.